Adding IoT data to seeview
There are three ways to display IoT data with seeview:
- IoT data can be rendered in a corner of the seeview screen at all times
- IoT data can be added as a news ticker item, to continuously display at the bottom of the slides on rotation
- IoT data can be added using a dynamic slide as part of your seeview playlist
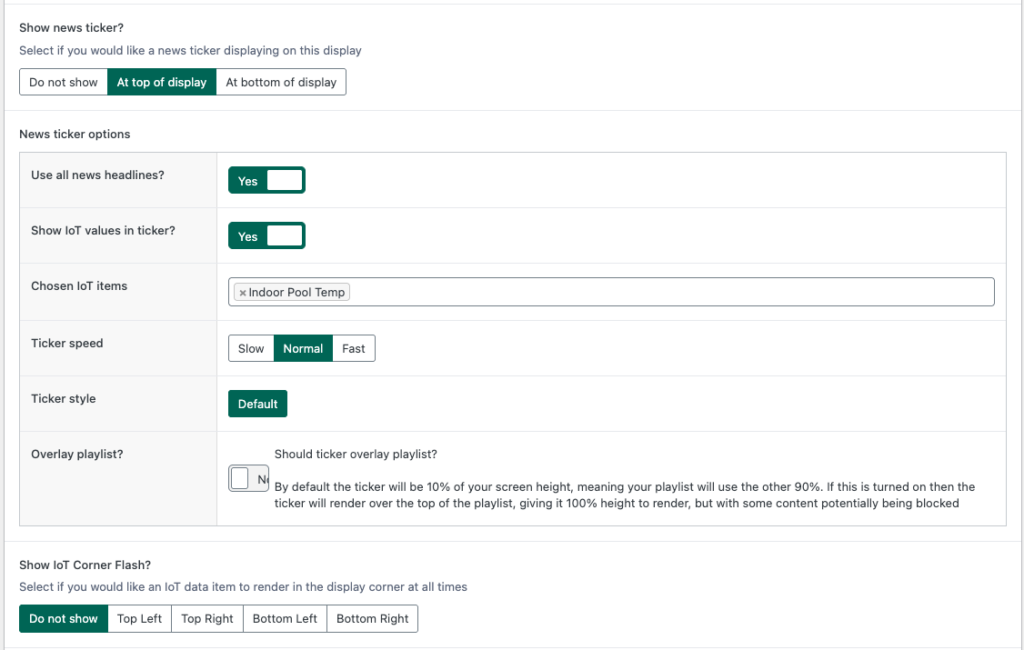
The first two ways are set in the same place, as part of the Display settings. When adding news ticker items, you can choose to include IoT values in the ticker, and then you can select the IoT data reading you want from the list set up.
Warning
Don’t forget – if you haven’t added any seeview display ticker text when setting up your IoT definitions, the ticker will only display the value.
Setting up IoT data on a display record
Just underneath your news ticker options is a section titled “Show IoT Corner Flash?” – with options to not show at all, or to show in any corner of the screen depending on your preference. This will display the IoT value as a permanent corner flash at all times.
Setting up seeview dynamic slides
Lastly – you can make use of the seeview dynamic slides to set up a more visual rendering of your IoT data. This can then be added to your normal playlists.
You would add your background as a static image, with a clear area defined to display the IoT data, in line with the options chosen. You can also choose to add several IoT readings to a slide. If the “Multiple” option was selected a button would appear giving you the option to add more IoT items.
You can add a title to be rendered before the value.
You would then select your IoT item from the drop down and then add a subtitle if needed. This can be used to add details like date/time the reading was last updated and this will appear just below the main value.

